
Sectional Times: The Hidden Layer in Greyhound Results
A finishing time tells you how fast a dog ran. A sectional time tells you how it ran — where it found speed, where it lost it, and whether the final clock flatters or deceives. At Monmore, where the standard 480-metre trip is over in roughly 29 seconds, the difference between a dog that blazed to the first bend and faded and one that started slowly and finished like a train is invisible in the headline number. Sectional times make that difference visible.
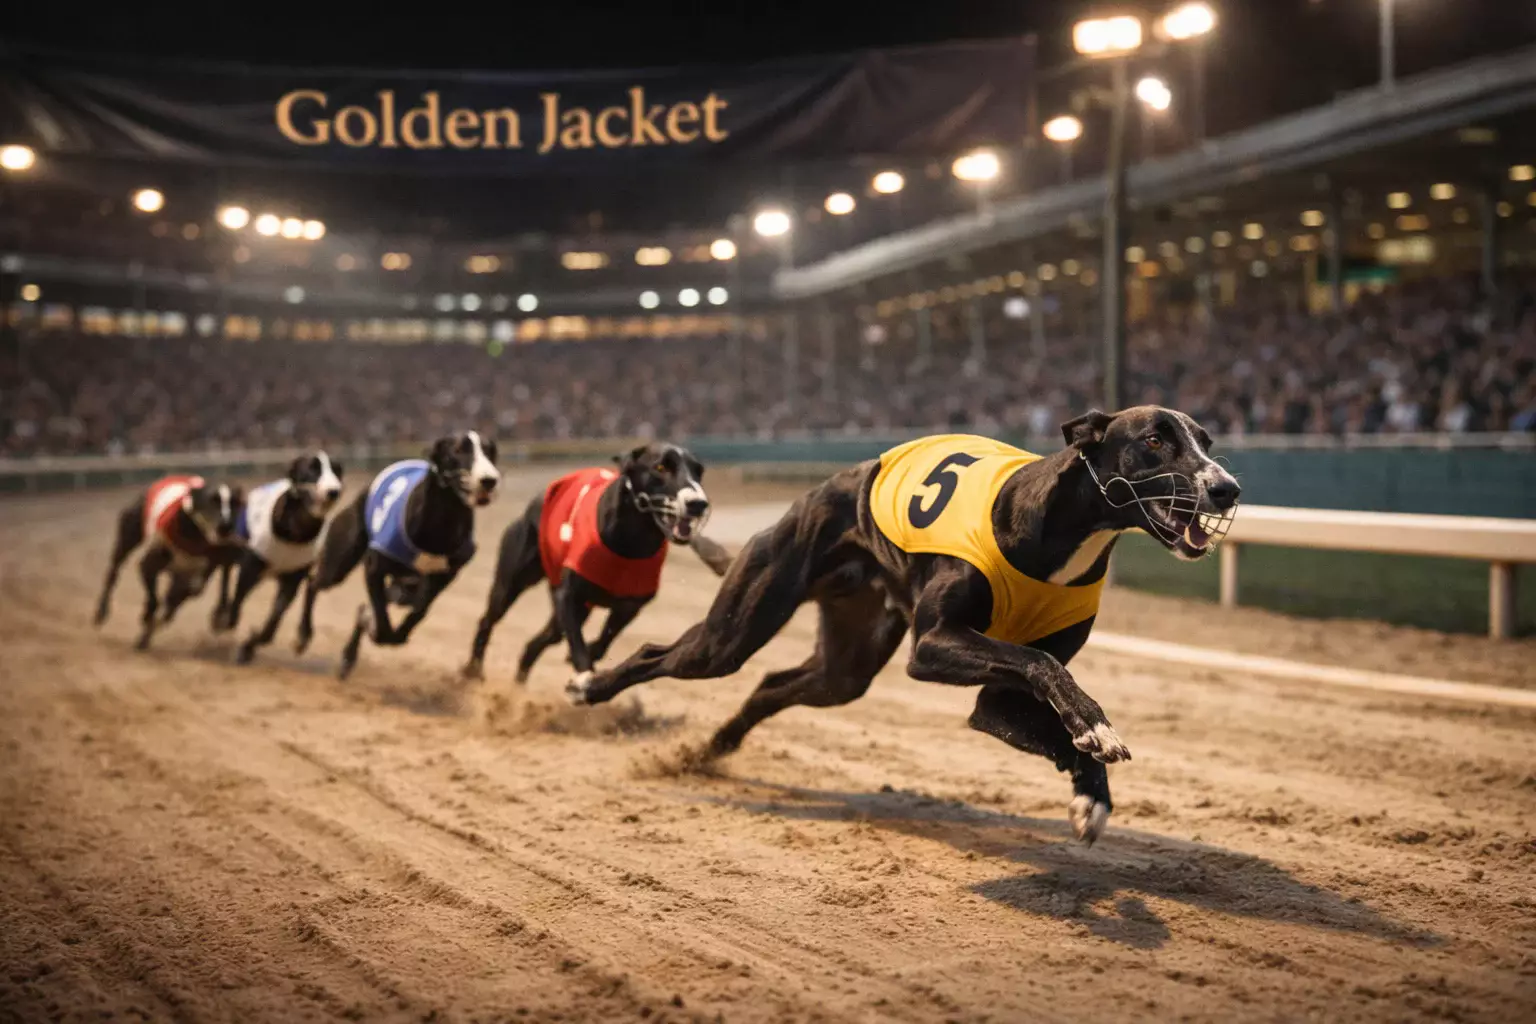
Most casual punters never look at sectional splits. They glance at the finishing time, compare it to the dog’s previous runs, and move on. That is a mistake, and it is one of the most reliable edges available to anyone willing to spend an extra minute with the data. Sectional times reveal running style, tactical ability, and genuine fitness in ways that a single clock reading cannot. At a track like Monmore, where the first bend sits just 103 metres from the traps and the entire circuit measures 419 metres, early pace is at a premium — and sectional times are how you measure it.
How Sectional Times Are Captured at Monmore
Sectional timing at Monmore works through electronic sensors positioned at fixed points around the track. The primary split is taken at the first bend — roughly 103 metres from the starting traps. This \u201crun to the bend\u201d time, often listed as the sectional or split time in results, tells you how quickly a dog reached the first corner from a standing start. On a standard 480-metre race, you will typically see two recorded times: the sectional (first bend) and the total (finish).
The run-to-bend time at Monmore over 480 metres is usually somewhere between 4.0 and 4.5 seconds for a competitive greyhound. That half-second range might sound trivial, but it represents the difference between a dog that leads into the bend and dictates the race and one that is already three or four lengths behind and fighting traffic. In a sport where most races are decided by margins of a length or two, the opening section is where the shape of the result is set.
For longer distances — the 630 m, 684 m, and 835 m trips — additional sectional points may be recorded, depending on the timing system in use and the data published by the results provider. Not all platforms show the same level of detail. Some give only the first-bend split and the final time. Others provide intermediate splits at the back straight or the third bend. The depth of available data varies, and knowing which provider gives the fullest sectional breakdown for Monmore is itself a form of analytical advantage.
The timing equipment is calibrated regularly as part of GBGB track standards, which means the sectional data is consistent enough to compare across meetings. A 4.15-second run to the first bend last Thursday means the same thing as a 4.15-second split this Saturday, assuming standard conditions. That consistency is what makes sectional analysis viable over time rather than just within a single meeting.
Reading Sections: Early Speed vs Late Run
Once you have the sectional split and the total time, the arithmetic is simple: subtract the first-bend time from the finishing time and you get the \u201crun home\u201d — the time taken to cover the rest of the trip after the initial dash. This run-home figure is where the real analysis begins.
Consider two dogs that both finish a 480-metre race at Monmore in 29.20 seconds. Dog A ran a first-bend split of 4.10 and a run home of 25.10. Dog B split 4.40 to the bend and ran home in 24.80. The headline time is identical. The stories are completely different. Dog A is an early-pace runner that got to the front, led the whole way, and held on. Dog B was slow away, had to navigate traffic through the first two bends, and unleashed a significantly faster run home to arrive on the same mark. Which dog ran better? In most situations, Dog B. The faster run-home time suggests greater inherent ability masked by a poor start. Next time Dog B traps cleanly, that 29.20 could become 28.80.
This kind of analysis is invisible if you only look at finishing times. It is obvious if you look at sections. Punters who focus on run-home times rather than total times tend to identify improving dogs before the market does, because the market — particularly the on-course SP market — reacts primarily to finishing positions and headline clocks rather than split data.
There is a caveat. Early pace has intrinsic tactical value at Monmore because the track is tight and the first bend comes up quickly. A dog that leads to the bend avoids trouble. A dog that misses the break has to race wide or check behind other runners, both of which cost time that may not be recoverable. So a fast sectional is not just about speed — it is about position, and position at Monmore is currency. The track record over 480 metres stands at 27.48 seconds, set by Ballymac Eske in 2012, and you can be certain that time was built on a sharp opening section that secured clear running from the start.
Using Sectional Times to Assess a Dog’s True Ability
The practical application of sectional times at Monmore boils down to three questions. First: is this dog’s finishing time a fair reflection of its ability, or was it compromised by a slow start or in-running interference? The sectional tells you. A dog that runs a fast section but a slow total was probably hampered after the bend. A dog that runs a slow section and a fast total is a closer that needs everything to fall right.
Second: is this dog improving or declining? Finishing times can be misleading because they are affected by the pace of the race, the quality of the field, and the running line. Sectional times are purer. If a dog’s run-home times are getting progressively faster across its last four outings even though its finishing times have been static, it is improving. The grading system has not noticed yet, the SP has not adjusted, but the sections are telling you to pay attention.
Third: how will this dog cope with a change in circumstances? If a dog moves from trap six to trap one, its first-bend sectional will almost certainly change — the rail draw favours a clean run to the bend, which should shave a tenth or two off the split. If a dog that normally leads is drawn wide and likely to miss the break, the section data tells you how it performs when it has to come from behind. Does the run-home time hold up, or does the dog only deliver when it leads? That question is answerable only with sectional data.
Building a sectional profile for a Monmore dog takes a few minutes and a spreadsheet. List the last six runs, record the first-bend split and run-home time for each, and look for patterns. You want to know the dog’s average section, its best section, and whether the sections are consistent or volatile. A dog that runs between 4.10 and 4.15 every time is a reliable trapper. A dog that oscillates between 4.05 and 4.45 is unpredictable from the boxes and carries more risk regardless of its finishing form.
None of this is complicated. It requires no advanced mathematics, no proprietary software, and no insider knowledge. It requires looking at a number that most people ignore. At a track like Monmore, where 103 metres separates the traps from the first bend and a tenth of a second at the opening split can determine the finishing order, sectional times are not an optional extra. They are the hidden layer in every result line, and every letter in that result means something if you know where to look.